CALAGE, EMBALLAGE, PROTECTION, PACKAGING, PIÈCE TECHNIQUE, LE POLYSTYRÈNE N’A PAS DE LIMITE !


La société Epact Industrie met tout en œuvre, depuis 1999, pour être à la pointe de solutions innovantes dans la transformation du polystyrène.
Bureau d'étude et moyens industriels
Un bureau d'étude intégré et un parc machine à la pointe permettent rapidité et souplesse d'exécution.
Recyclage de vos déchets
Collecte, traitement et valorisation, Epact industrie vous accompagne jusqu'au bout et s'engage dans le recyclage de vos déchets en polystyrène.
Focus produits

LE COMPLEXAGE
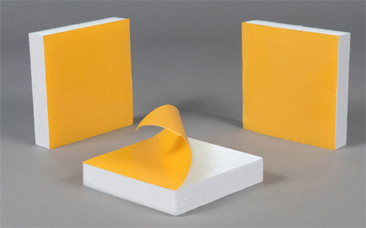
Suivant vos besoins, le polystyrène peut être associé à un autre matériau pour répondre parfaitement à votre cahier des charges. PSE et carton, PSE et adhésif, PSE et mousse de polyéthylène, les possibilités sont quasiment sans limites !

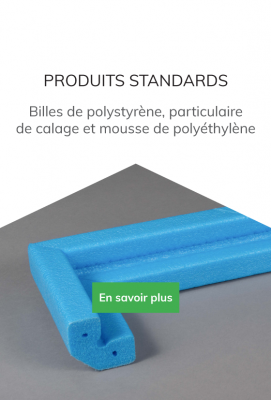
LA BILLE DE POLYSTYRÈNE
Pour le garnissage de poufs ou pour le secteur du bâtiment, Epact industrie produit des billes 100% françaises !

LES PIÈCES MOULÉS SUR-MESURE
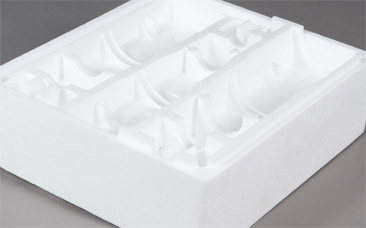
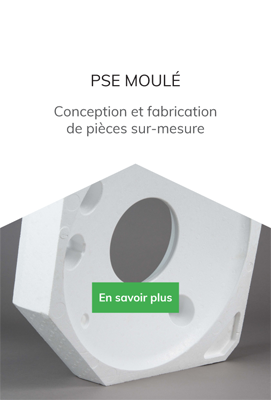
Un bureau d'étude vous accompagne dans les moindres détails de votre projet. Le polystyrène moulé garantit une réalisation parfaitement conforme à votre cahier des charges.


